David's Astronomy Pages
Notes - CCD Imaging Performance
2001-Oct to 2002-Jan
Notes
(S16)
Notes
(Main)
Home
Page
Notes
(S17)
David's Astronomy Pages
|
Notes (S16) |
Notes (Main) |
Home Page |
Notes (S17) |
Imaging Performance and Experience
- CCD Sessions S00002 to S00016I have now had my ST7 CCD camera for around 4 months now. This page describes an assessment of the performance of my imaging setup.

Summary Seeing FWHM Analysis Autoguiding Analysis ABG , Collimination & Dew Observations and Fun Science Image and Note Links
[ Goto to CCD Imaging ]
My backyard suburban site has very poor seeing (FWHM 4.0 to 5.6 arc secs, with best of around 3.5 arc secs to date).
With this seeing, images taken at 2x2 binning provide the most information in a give exposure time. This give images of 382 x 255 pixels at a typical scale of 1.74 arc sec/pixel. For planets, moon and other bright objects 1x1 binning is still used.
With my normal operating focal length I'm imaging sky areas of 11.1 x 7.4 arc mins
My LX200 mount typically suffers some periodic errors together with random errors of up to +/- 4 arc secs in Dec and +/- 2.5 arc secs in RA. Tracking errors can be reasonably well compensated by autoguiding.
My CCD Imaging is generally Seeing Limited
My scope suffers from some mis-collimination
I need to be taking flat fields more consistently
I've suffer some problems from dew towards the end of some sessions
It is strongly suspected that I was supplied with an ABG camera rather than the Non-ABG camera that was ordered.
Back to Top
My backyard site is in a suburban area. Two major towns lies to the SW and SSE. There are neighboring houses and street lights. As expected the seeing is fairly poor.
CCD imaging has allowed me to quantify the seeing, by examining the Full Width at Half Maximum values (FWHM) in my images, using the method described under FWHM Analysis.
FWHM of images taken during last 4 months varies from around 4.0 to 5.6 arc secs, with best of around 3.5 arc secs to date. Variation is partly date/weather related and partly sky position related (images of sky taken closer to southern horizon seem to have higher FWHM), however this variation has been systematically analysed.
Back to Top
I'm presently using CCDSoftV5 (Software Bisque) for analysing my images. CCDSoft has an option to 'Insert WCS/Perform AutoAstrometry'. When performed on an image, an output '.src' file is generated which can contains information on the pixel position, FWHM, ellipticity, and relative magnitude of each object or star within the image. I import this '.src' dataset into an Excel spreadsheet for selected images and plot a graph showing FWHM against Calibrated Magnitude.
FWHM is calculated in arc secs, by multiplying the 'FWHM_Image' (in pixels) by the image scale (in arc secs/pixel) which is appropriate to the image. When 'Insert WCS' is successful the image scale is shown by the Bisque software. [ I have checked the FWHM_Image values for correctness by examining a tabulation of the ADU values in an image, calculating for myself the FWHM across certain stars, and checking them against the values calculated by CCDSoft.]
Calibrated Magnitudes are calculated by adding a specific
correction number to 'MAG_APER' to bring them in line with either 1) calibrated
magnitudes which have been determined by interrogating the image within
CCDSoft using the cursor information window (this is where
'Insert WCS' has been successful), or 2) catalog magnitudes
which have been determined by examining the image area within TheSky (this
is were 'Insert WCS' has been unsuccessful due to too few matching stars).
[To get Mag_Aper values to start out reasonably close to the
Calibrated Magnitudes values, I set 'Magnitude Zero Point' in Source Extraction
Setup to 24. Final Correction Factors are then within +/-2 ]
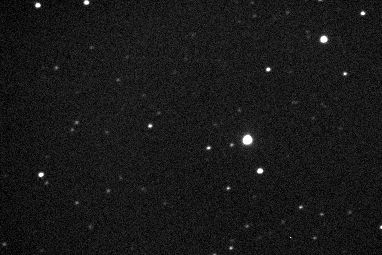
The following plot shows the FWHM analysis of an unguided 30 sec exposures of SAO 113277 (25 arc min NE of Betelguese). It shows a FWHM of 4.6 arc sec.
The following plot shows the FWHM analysis of a 5 min self-guided exposure of C/2000 SV74 . FWHM values is around 4.0 arc secs.
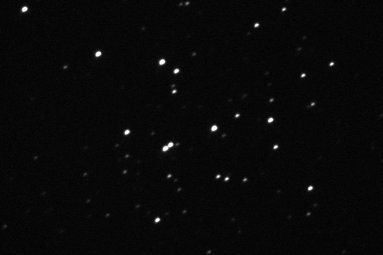
In this final example, a 20 second unguided exposure of M36 (#14005), the FWHM is around 5.3 arc sec.
FWHM values determined will be not only be related to seeing,
but also related to focusing , and tracking/guiding errors. To get the
best quantification of Seeing I examine only the best focused images and examine
both short unguided images and longer guided images.
In an attempt to assess Seeing which was independent from the quality of
telescope tracking, I once examined a 11
sec drift scan image from which I determined that FWHM varied
from 4.4 to 7.3 arc secs, with average of 6.6 arc secs (P50 of 7.0 arc secs)
Links to FWHM Analyses :
Double-Double Image (2001-09-25, S00002)
NGC 7242 Images (2001-12-14, S00013)
C/2000 SV74 Images (2001-12-14, S00013)
M1 Images (2001-12-14, S00013)
M36 Image (2001-12-20, S00014)
Horsehead Nebula Image (2002-01-11, S00015)
Drift Scan Image (2002-01-17, S00016)
SAO 113277 Image (2002-01-17, S00016)
Vesta Images (2002-01-17, S00016)
Back to Top
I'm using CCDSoftV5 for controlling my ST7e camera. CCDSoft outputs an 'autoguider.log' file which can contains information on guiding errors and corrections. I import the dataset into an Excel spreadsheet and plot information for selected autoguiding sessions. GuideErrX and GuideErrY (in pixels) are multiplied by the X and Y imaging scale of the guiding CCD chip (in arc secs/pixel) to give the X and Y Guide Error (in arc secs). When the CCD camera is appropriately orientated , then X Guide Error corresponds to Guide Error in RA and the Y Guide Error corresponds to the Guide Error in Dec.
The following plot (series 114) shows the guiding errors for one particular guiding session. The guide errors are relatively low. The X (RA) error is generally <= +/-2 arc secs. Y (Dec) error is generally <= 1 arc secs, though a 3 arc sec random error occurs at just after 1.1/2 minutes.
In contrast the following plot (series 118) shows rather larger guiding errors. The X (RA) error is around -4/+2.5 arc secs, whilst Y (Dec) error is +/-4 arcs. These relatively large errors may explain in part the particularly poor FWHM values associated with the resulting image (5.5 to 6.0 arc secs).
Autoguiding Analysis
Autoguiding Analysis (2001-12-14, S00013)
Autoguiding Analysis (2002-01-11, S00015)
Autoguiding Analysis (2002-01-17, S00016)
Back to Top
Collimination, ABG & Dew
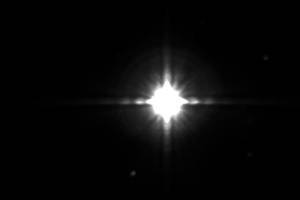
ABG Camera
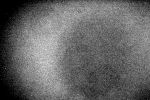
The following image of Betelguese (#16015) is saturated, with many pixels at the maximum count level of 65535 ADU. The image shows no sign of blooming and it is strongly suspected that I was supplied with a ABG camera, rather than the Non-ABG that was ordered.
Collimination
Whilst tests on individual stars could not detect any significant
mis-collimination, the offset vignetting pattern consistently seen in images
with contrast turned up and in flat fields indicates that the scope does have
some mis-collimination, which needs to be corrected (see Flat field image below
for example)
Dew
The ends of the last two observing sessions have seen dew formation on the front of my scope. The following flat field points at the impact of the dew
Back to Top
During my first 4 months use of my CCD camera I have been able to examine a wealth of astronomical objects, some examples are
Moon (2001-10-03, S00005)
Saturn and Jupiter (2001-10-31, S00008)
6 moons of Saturn (2001-11-08, S00010)
Comet C/2000 WM1 (2001-11-26, S00011)
Cluster of Mag +13.7 to +15.0 galaxies (Fath) (2001-12-10, S00012)
Supernova 2001ib in NGC 7242 (2001-12-14, S00013)
M1 crab nebula (2001-12-14, S00013)
Minor planet 4 Vesta (2002-01-17, S00016)
My personal highlight of the four month period was imaging SN 2001ib, a supernova or star explosion in a galaxy some 255-382 million light years away.
| SN 2001ib |
|
| NGC 7242, with supernova
SN 2001ib Image shows stars down to Mag +16.5 2001-12-14, 20:55 to 21:05 UT, CCD Image, 2 x 5 min (#13016-17) Image scaling 1.74 arc sec/pixel |
Back to Top
Main images are recorded on following pages
| Date & Session No. | Images | Notes & Tests |
Objects |
| 2001-09-25 (S00002) | Images | Notes | Double-Double in Lyra |
| 2001-09-29 (S00003) | Images | Moon | |
| 2001-10-03 (S00005) | Images | Moon | |
| 2001-10-11 (S00006) | Images | NGC 7331 | |
| 2001-10-31 (S00008) | Images | Jupiter/Saturn | |
| 2001-11-01 (S00009) | Images | C/2000 WM1 (LINEAR) | |
| 2001-11-08 (S00010) | Images | Jupiter/Saturn Moons | |
| 2001-11-26 (S00011) | Images | C/2000 WM1 (LINEAR) | |
| 2001-12-10 (S00012) | Images | NGC 708 & adjacent galaxies | |
| 2001-12-14 (S00013) | Images | Notes | Supernova SN 2001ib, M1 (Crab Nebula), Comet C/2000 SV74, M42 (Great Nebula) |
| 2001-12-20 (S00014) | Images | Notes | M36 |
| 2002-01-11 (S00015) | Notes | Horsehead Nebula | |
| 2002-01-17 (S00016) | Images | Notes | 4 Vesta, Saturn |
Back to Top
| This Web Page: | Imaging Performance (2001-09 to 2002-01) |
| Last Updated : | 2015-05-16 |
| Site Owner : | David Richards |
| Home Page : | David's Astronomy Web Site |