David's Astronomy Pages
|
Notes (S358) |
Notes (Main) |
Home Page |
Notes (S360) |
|
2009-03-29 Restart from Park Position Polar Alignment Checks Tracking Rate Adjustment Trials PEC Training Automated Filter Adjusted Focusing - M13 Collimation and Image Curvatures Measurements >
Start up from Park. GPS fix achieved after 10 asterisks.
Usual fix after 3 to 7 - is the longer fix this time because it's 01:40 h local
time and GPS satellite coverage is lower ?
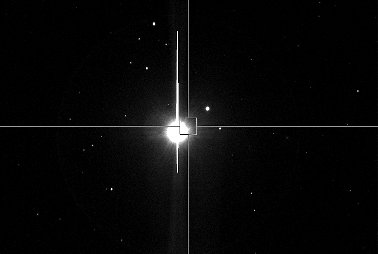
Slewed from Park Position to Regulus and took this 3 sec snap. The star is
pretty much centered and a re-sync could be ignored.
|
Regulus (Leo) |
|
|
CCD Image (52% size reduction) with Cross Hairs 3s (single frame), 3x3 binning, C Filter 2009-03-29 01:40 h UT (#snap 0140-54) 12" LX200R (at f/5.7) + ST-10XME |
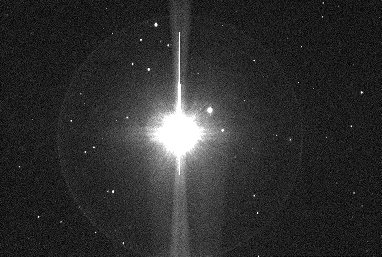
| Regulus - with circular light artifact surrounding star |
|
|
CCD Image (52% size reduction) Image details as above adjusted black/white range |
Back to Top
A short Drift Align check were made to confirm previous measures of the accuracy of the telescope's Polar Alignment and test for star drift with Tracking Rate Adjusted to +1 setting
The N-S drift of a star in the Southern Sky (near to Meridian & Declination 0)
were measured from images taken approximately 12 minutes apart.
Images pairs - Binning 2x2, Plate Scale 1.612, Exposure 10
secs.
This Session (S359)
N-S Star Drift : 0.29 arc secs/min NORTHWARDS
(Polar axis pointing 1.12 arc mins too far west - requiring that wedge is rotated
very slightly clockwise)
Previous Session (S358)
N-S Star Drift : 0.27 arc secs/min NORTHWARDS (Polar axis pointing 1.04 arc mins too far west
- requiring that wedge is rotated
very slightly clockwise)
Back to Top
Image Pair created for the Drift Align Check also indicate that stars are drifting westwards by 16.6 pixels in 12.07 minutes (at 1.611 arc sec/px). This is equivalent to a rate of 2.2 arc sec/minute, but is subject to significant uncertainty due to Periodic Error as PEC was turned off at the time.
Session Tracking Rate
AdjustmentStar Drift (in RA) Actual Tracking Rate
Notes S356/357 'Sidereal' Westwards by 1.9 arc secs/minute Slow by 0.21% South Sky Point (w/o Pec) S358a 'Sidereal' Westwards by 3.2 arc secs/minute Slow by 0.34% South Sky Point (with Pec) Westwards by 4.1 arc secs/minute Slow by 0.34% West Sky Point (with Pec) S358b +3 Eastwards by 2.5 arc secs/minute Fast by 0.28% South Sky Point (with Pec) S359 +1 Westwards by 2.2 arc secs/minute Slow by 0.24% South Sky Point (w/o Pec)
Back to Top
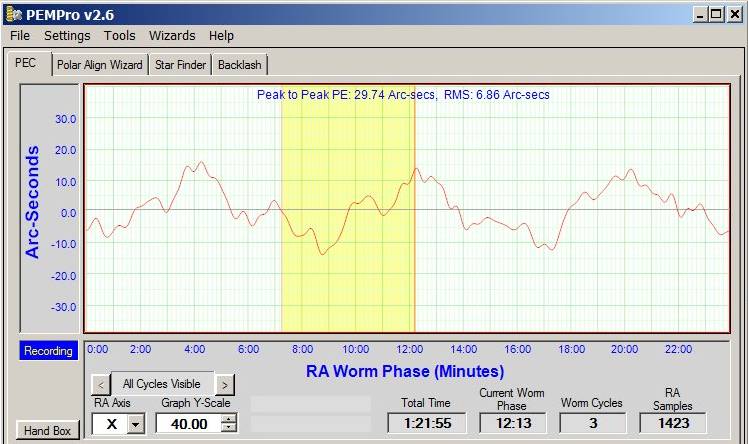
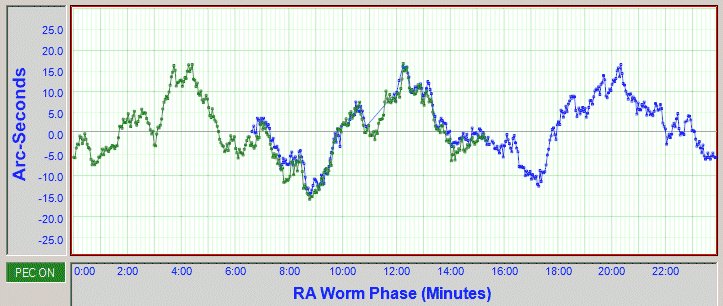
PEC training was attempted using an evaluation copy of PEMPro v2.6
|
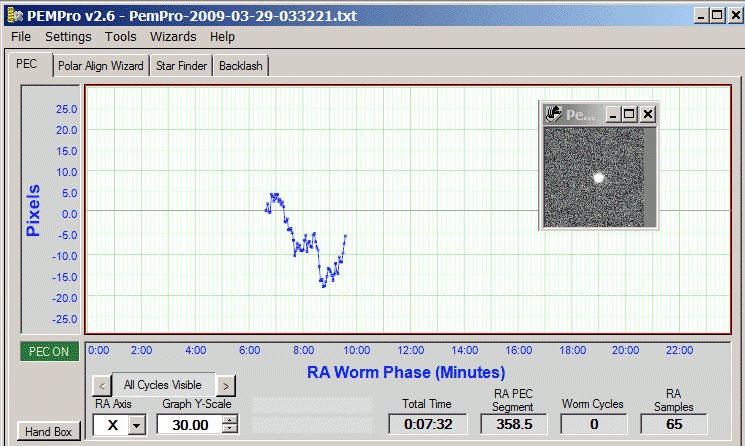
PEMPro acquiring data, using ST-10XME camera/via CCDSoft (Although
the PEC indicator shows that PEC was "ON" during the
acquistion run, the LX200R's PE table |
||||||||||||||||||||||||||||||
|
||||||||||||||||||||||||||||||
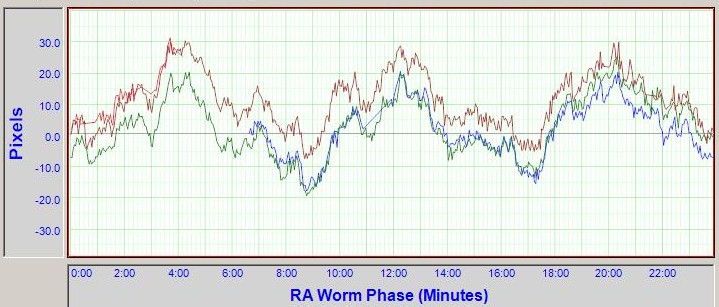
| PEMPro acquiring data from second 24 minute cycle | ||||||||||||||||||||||||||||||
|
||||||||||||||||||||||||||||||
| All data | ||||||||||||||||||||||||||||||
|
||||||||||||||||||||||||||||||
|
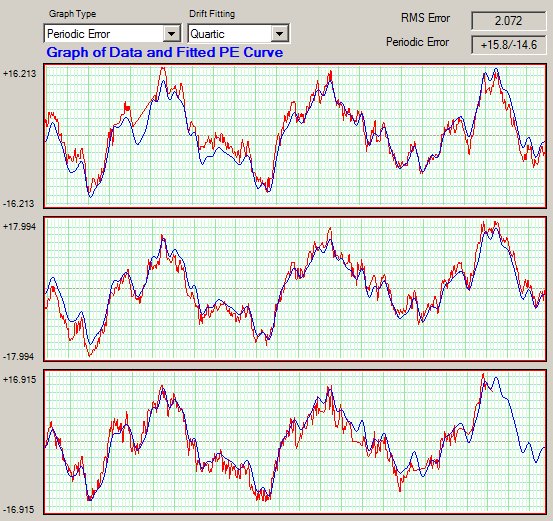
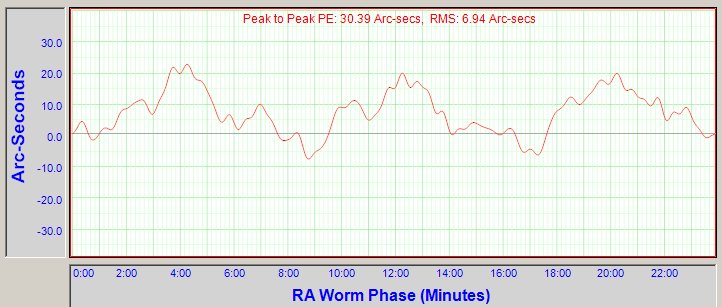
Creating the PE Curve
PE Curves were examined with different
Drift Fittings (from First to Fifth Order). They show dereasing RMS Error
with Order,
The Fifth Order curve has lowest RMS, but
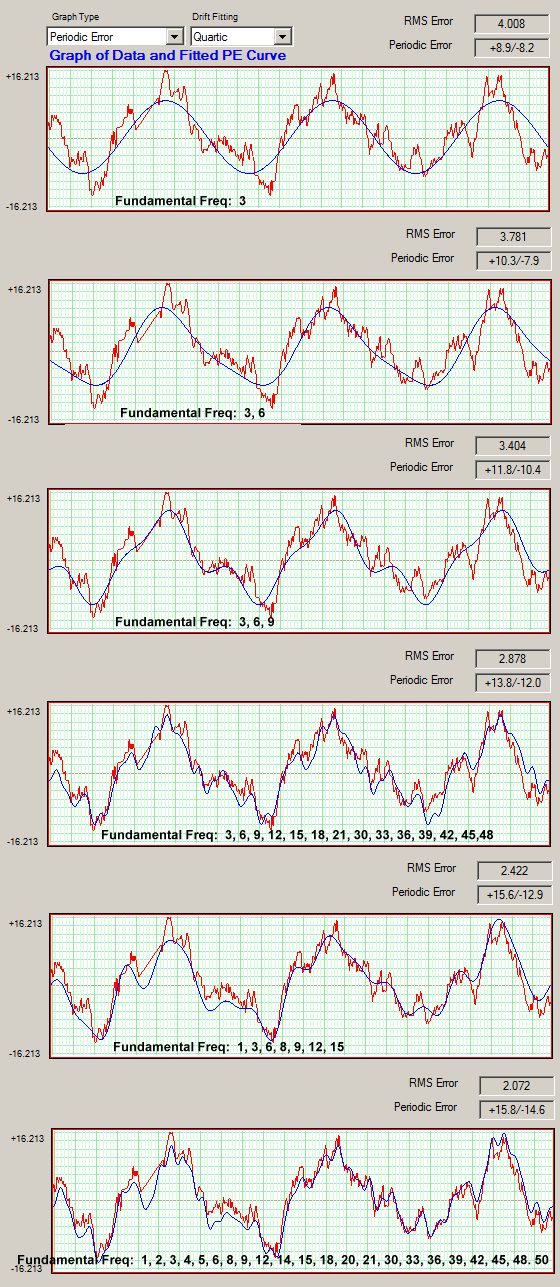
risks optimising out some of the periodic error, since I had Graphs of Data and Fitted PE Curve are shown below. |
||||||||||||||||||||||||||||||
|
||||||||||||||||||||||||||||||
| Shown below is PE curve (quadratic drift fitting) with and without data points | ||||||||||||||||||||||||||||||
|
||||||||||||||||||||||||||||||
|
||||||||||||||||||||||||||||||
|
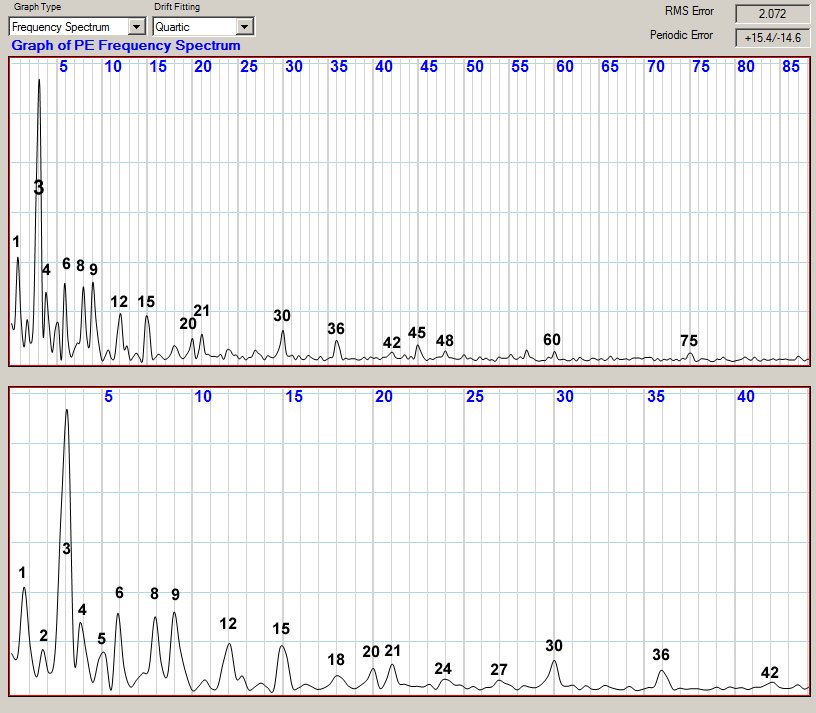
PEMPro allows the different frequencies
involved in the Periodic Error to be identified and
quantified. Testing PE curve with different Fundamental Frequencies |
||||||||||||||||||||||||||||||
|
||||||||||||||||||||||||||||||
|
To explore the influence for different Fundamental Frequencies, the PE curve was examined with different combinations of frequency. Testing PE curve with different Fundamental Frequencies |
||||||||||||||||||||||||||||||
|
||||||||||||||||||||||||||||||
|
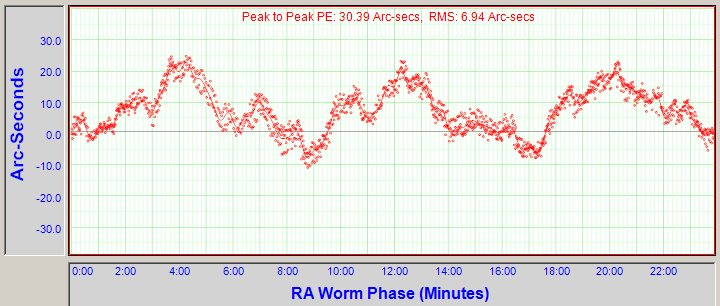
PEMPro has the ability to upload the PE
curve directly to LX200GPS and LX200R scopes. However during the live
session the wrong route was taken and I began playing back the curve to
the Mount. This took 24 minutes to perform and was completely in
vain as the LX200 Autostar II was not setup in PEC training mode. As
a result the scope was still left without the PE table. |
||||||||||||||||||||||||||||||
|
PEMPro- created PE curve and playing back curve to Mount (Peak to Peak PE : 29.7 arc secs) |
||||||||||||||||||||||||||||||
|
|
Back to Top
|
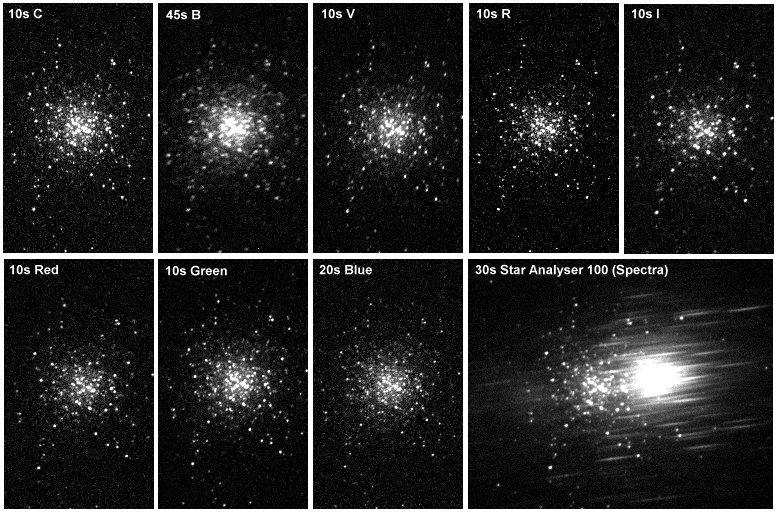
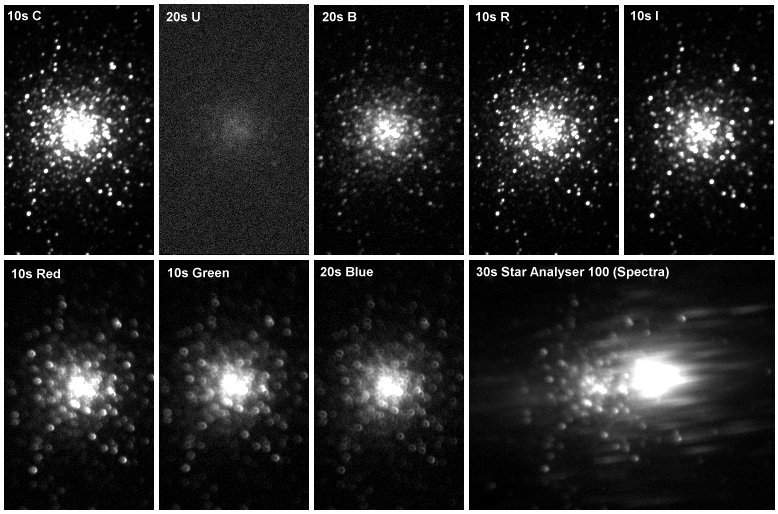
M13 taken through different Filters
using CFW10 Filter Wheel |
|
|
CCD Image Montage 10-45s exposures (single frames), 3x3 binning, Various Filters 2009-03-29 (#359012-29), 12" LX200R (at f/5.8) + ST-10XME |
| Focus Offsets for the CFW10 filter set at f/5.6 (defined 2009-03-16) |
|
|
Previous images of M13 taken on First Light Session -
2009-03-09
Filtered Images all taken at the same focuser
position |
|
|
CCD Image Montage 10-30s exposures (single frames), 3x3 binning, Various Filters (Images are all taken using the same Focus Position) 2009-03-09 (#356188-237), 12" LX200R (at f/5.8) + ST-10XME |
Back to Top
An evaluation copy of CCD Inspector 2.1.6 (by
CCDWare) was used to review collimation quality of images taken during the first 3 sessions with the new Imaging Setup.
The figures below indicate an initial collimation error of around 35-42". ,
which was only slightly improved by the 'manual' re-collimation attempt in
session 357.
(The main difference pre- and post re-collimation was the the collimation
error flipped from one side of the CCD to the other)
The figures reveal a curvature value of 16-27%. This is a relatively low number
and shows the improvement of Meade's ACF (R) optical design over the standard SCT
design.
Session Images Stars
Aspect
Ratio
Curvature
Collimation
(arc secs)Average FWHM
(arc secs)Tilt X Tilt Y Total Tilt S356 (First Light Session) 30 x 30s 148 +/- 13 38 % +/- 20% 16 % +/- 1% 41.6" +/- 6.3" 5.4" +/- 0.7" -0.9" +/- 0.1" -0.3" +/- 0.1" 16% @ -157 deg S356 (First Light Session) 6 x 60s 410 +/- 22 38 % +/- 10% 27 % +/- 1% 35.0" +/- 6.5" 5.3" +/- 0.3" -1.1" +/- 0.2" +0.5" +/- 0.1" 20% @ -149 deg S357 Collimation attempt S358 7 x 90s 575 +/- 40 19% +/- 8% 24 % +/- 2% 36.3" +/- 6.3" 5.5" +/- 0.4" +0.9" +/- 0.2" +0.1" +/- 0.1" 15% @ - 5 deg S358 6 x 45s 633 +/- 73 14% +/- 3% 21 % +/- 2% 31.7" +/- 7.6" 4.9" +/- 0.4" +0.7" +/- 0.2" +0.3" +/- 0.1" 10% @ - 22 deg S358 3 x 60s 695 +/- 80 16% +/- 6% 24 % +/- 1% 36.1 +/- 4.0" 5.9" +/- 0.6" +0.9" +/- 0.1" +0.1" +/- 0.0" 14% @ - 9 deg
Back to Top
| This Web Page: | Notes - Session 359 (2009-03-29) |
| Last Updated : | 2015-05-16 |
| Site Owner : | David Richards |
| Home Page : | David's Astronomy Web Site |