David's Astronomy Pages (Projects)
|
Variable Stars |
Home Page |
|

HD 5501 - Eclipsing Binary (2006-09-14 note) This page summarises observations and images of eclipsing binary star HD 5501 and two other suspected variables in same star field
- a possible new eclipsing variable HD 5513
- a possible slowly varying star HIP 4429HD 5501 - Comparison Star QC (2006-10-18) HD 5501 - Re-Analysis (2006-12-30) HD 5513 - Suspected New Eclipsing Variable HIP 4429 - Suspected Variable HD 5513 - Re-Analysis using Binary Star Modelling (2008-07-04)
[ written 2006-09-14, graphs updated with extra points on 2006-10-05 ]
Photometric studies of HD 5501 are being conducted as a follow -up to recent discovery of this peculiar eclipsing binary by Mais, Gray & Richards (2006). The notes below record ongoing progress of the study.
Introduction
Methodology
Measurements
Results
Discussion / Future Work
Introduction
HD 5501 (= BD+59 154 = BSD 8-397) is a 9th magnitude star in the constellation
of Cassiopeia. It has recently been discovered to be an eclipsing
binary with a period of 7.53 days with a primary eclipse of 0.45 magnitude and a
secondary of 0.3 magnitude. The system is constantly varying suggesting an
ellipsoidal variable with the stars in or near contact, perhaps with one or both
Roche lobes filled. (The Discovery and Initial Characterization of a New
Eclipsing Binary with Peculiar Properties, Mais, D. E.; Gray, R.O.;
Richards, D., Society for Astronomical Science 2006).
My contribution to the initial characterization of this new Eclipsing Binary was through software support to the project, specifically the provision of my Variable Magnitude Analysis (VMA) program which enabled fast, automated magnitude determination of images taken by Dale Mais over the course of nearly a year.
As a follow up to this original work, I've made my own observations of HD 5501 to confirm the star's period and potentially provide additional insights into the character of this eclipsing binary.
|
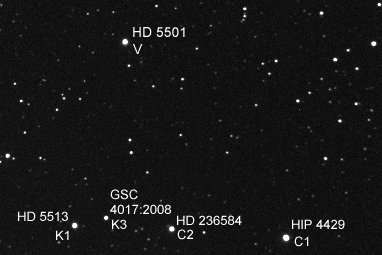
HD 5501 (Cassiopeia) |
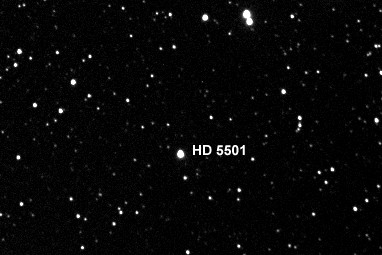 |
| Annotated CCD Image 30 sec exposure, 2x2 binning, C Filter 2006-04-23 21:49h UT (#116018) |
Methodology
Photometry was conducted with a Meade LX200 8" operating a F/6.7 using an
ST- 7e camera, 2x2 binned pixels and Bessell BVR filters.
Initial work began with with locating the HD 5501 and establishing a standard target position that would cover HD 5501 together with suitable comparison stars (frame size 16.5 x 11 arc minutes). After a little experimentation a position 3.9 arc min S, 3.0 arc min W of HD 5501 was chosen, which enabled the following comparison stars to be accessed.
| Ref. ID | Star ID | Bt | Vt | B | V | R | B-V | V-R | |
| HD 5501 | HD 5501 | 9.15 | 8.82 | 9.08 | 8.80 | 8.63 | 0.29 | 0.17 | |
| C1 | HIP 4429 | 10.00 | 8.69 | 9.68 | 8.57 | 7.97 | 1.11 | 0.60 | |
| C2 | HD 236584 | 11.77 | 9.83 | 11.29 | 9.65 | 8.77 | 1.64 | 0.88 | |
| K1 | HD 5513 | 9.37 | 9.18 | 9.34 | 9.17 | 9.06 | 0.17 | 0.11 | |
| K3 | GSC 4017:2008 | 10.66 | 10.59 | 10.66 | 10.59 | 10.54 | 0.07 | 0.05 |
Note : Bt, Vt magnitudes in table above are from Tycho catalog.
B, V, R magnitudes are transforms from Bt, Vt using Arne Henden's best fit transform equations [also documented at Tass-Survey.org reference ]
HD 5501 and Reference Stars
Annotated CCD Image
30 sec exposure, 2x2 binning, C Filter
2006-04-23 21:49h UT (#116018)
Two comparison stars were used (HIP 4429 and HD236584). Ideally these stars should have colours which are more similar to HD 5501 in order to minimise secondary extinction effects, however the first choice reference star (HD 5513) was found to be variable, or at least apparently so, and could not be used as a valid comparison or control star. GSC 4017:2008 was used as the control star.
Images were obtained as sets of 3 images in each filter bands (initially B & V bands, but subsequently B, V & R bands). Exposures in B, V, and R filters were 60s, 30s, and 30s respectively and were chosen to provide reasonable Signal -to-Noise, without saturating the stars and without entering non-linear range of the CCD chip. Image reduction was carried out using CCDSOFT using appropriate Dark and Flat support frames.
Magnitude determinations was performed using specially written scripts (VMA routines with my AIS program) and collated using an Excel Workbook. At the present time the comparison star magnitudes/colour values have not be separately checked and there has not yet been any attempt to fully transform the magnitude results to Standard BVR magnitudes. Nevertheless the relative magnitudes obtained so far are still considered to be useful.
For each image the magnitude of HD5501 and control star was calculated using the equation
M [star] = mi[star] + ( M[comp1] - mi[comp1] + M[comp2] - mi[comp2] ) / 2
where mi is Instrumental Magntitude and M[comp] is the comparison star Magnitude in Filter Band
For each set of 3 images in each band the average magnitude value was calculated after first rejecting frames where Signal To Noise was particularly low or anomalous related to passing cloud. Skies at my observing site are not particularly photometric and it can be a challenge to preserve sufficient data whilst maintaining data quality.
Measurements
Individual image measurements are collated within an Excel Workbook and plotted. Average magnitude measurements in B, V & R bands are shown in the three graphs below:
 |
 |
 |
|
|
Initial monitoring led to a suspicion that observations on 2006-07-18 (V 0.15m below 'normal') formed part of an eclipse event. However it was not until a run of good weather between 2006-09-02 and 2006-09-10 that a more complete set of data could be collected which confirmed the variability of the star and illuminated its pattern.
|
|
A full assessment of error bars associated with
measurement is still to be conducted, however initial assessment indicates the
variation in HD 5501's brightness is significantly larger than the stochastic
and systematic variation seen in the control star. However there is some concern
that the control star variation isn't more flat. This might indicate
a small variation in either one of the Comparison Stars (C1 or C2) or the
control star (K3).
[ This variation has been subsequently investigated ]
Differences are noted between the expected and the measured colour indices for
HD 5501 and control star. These are tabulated below :
| Ref. ID | Star ID | Mag/Colour | B | V | R | B-V | V-R | |
| HD 5501 | HD 5501 | Expected | 9.08 | 8.80 | 8.63 | 0.29 | 0.17 | |
| HD 5501 | HD 5501 | Measured (Av.) | 9.27 | 8.66 | 8.30 | 0.61 | 0.35 | |
| K1 | HD 5513 | Expected | 9.34 | 9.17 | 9.06 | 0.17 | 0.11 | |
| K1 | HD 5513 | Measured (Av.) | 9.46 | 9.02 | 8.83 | 0.44 | 0.19 | |
| K3 | GSC 4017:2008 | Expected | 10.66 | 10.59 | 10.54 | 0.07 | 0.05 | |
| K3 | GSC 4017:2008 | Measured (Av.) | 10.89 | 10.50 | 10.31 | 0.39 | 0.18 | |
A variety of possible explanations have been identified, which require further investigation. However a consistent feature is that the above stars are calculated as being brighter and redder than expected (this may be significant in formulating an explanation and appropriate correction)
magnitudes used for Comparison Stars might be wrong
expected magnitudes/Colour Indices of HD5501 and the control star might be wrong.
colour differences have not been accounted for
data is not transformed to Standard Magnitude
Results
Results of magnitude and colour determinations of HD 5501 to the present date
are presented in the following graphs
 |
 |
 |
 |
The above graphs indicate a variability in brightness with time, but with a relative uniformity in colour.
The graphs below show the magnitude and colour determinations folded using the previously proposed period of 7.53 days.
 |
 |
An alternative folding of the data is shown below where a period of 3.675 days is used (exactly half the previously proposed period)
 |
During the first 3 months of the study it was noted that the offset star HD 5513 (8.3 arc min from HD 5501) shows possible brightness variations of between 0.1 and 0.25m. [Plots for HD 5513 are shown separately ]
Discussion / Future Steps
Photometry data recorded to date indicate a variability in HD5501's brightness with time, with a relative uniformity in colour, which is typical of an eclipsing variable. Initial assessment involving folding the data suggests that the brightness variability is consistent with the previously proposed period of 7.53 days, with a primary and secondary eclipses of around 0.3 - 0.4m depth. However the data could be also be folded with 3.675 days with just a single significant eclipse of 0.4m depth
Further monitoring will be performed to further characterize HD 5501's variability.
At the same time further monitoring will be performed on the offset star HD 5513.in order to confirm it variability and if appropriate characterize the variability.
David Richards (Sept 2006)
Back to Top
The above note on HD 5501 described a concern over the variability seen in the calculated brightness of the control star (K3). Ideally the control star would be approximately flat indicating that the comparison star(s) were not varying and could be considered sound reference stars. Although the control star variation (+/- 0.05m) was much less than the variation shown by HD 5501 (+/- 0.15m), it may potnetially indicate a source of reduced measurement accuracy. The control star variation would appear to indicate a potential variability in either the control star (K3) or one of the two comparison stars used (C1 or C2/K2). [ It had already been noticed that the original first choice comparison star (HD 5513) was showing a clear variation, which required it to be rejected as a valid comparison star ]
To investigate where the problem lay, each star (C1, C2/K2, K3) was used in turn as a comparison star to calculate a V Band magnitude for the other two stars. The three resulting graphs (shown below) highlight that the largest variation in calculated check star magnitudes and accompanying strongest correlation between the calculated magnitudes of the check stars is seen when C1 is used as the comparison star - this strongly suggests that it is the C1 star (HIP 4429) which is showing variable behavior, responsible for the variation in control star magnitude.
On the one hand this removes a further star from list of offset stars that can be used as comparison star, but on the other points to a second 'new' variable star found during this study.
 |
 |
 |
Back to Top
Following a QC of earlier used comparison stars it was decided that a reanalysis of HD 5501 was required in order to remove the affect of the C1 star variability that was potentially reducing the accuracy of earlier magnitude estimates. This time the C2/K2 reference star (HD 236584) was used as the sole comparison star, with K3 star acting as the control star again.
New graphs are shown below (with data up to end
2006)
Principal conclusions on HD 5501 from earlier note (2006-09-14) are
unchanged. Some concern remains over the calculated colour indices,
however this is mainly considered to be due to uncertainty in the colour indices
of the comparison star used, and does affect the conclusions on presence of
variability, period & eclipse depth.
 |
 |
 |
 |
 |
 |
 |
Back to Top
As part of photometric studies of HD 5501 it was
found that HD 5513 shows brightness variations of between 0.15 and 0.30m. Further monitoring is being undertaken to see if variation can be
confirmed or otherwise explained and if there is a regular period or pattern.
As of 2006-12-30, the data is providing a light curve consistent with an eclipsing binary with
a period of approximately 1.198 days. The transit appears to be 4.3 to 6.0
hours long (15-21% of period) with a depth of approximately 0.3m.
In the analysis below the C2 reference star (HD 236584) was used as the sole
comparison star, with K3 star acting as the control star.
|
Image showing HD 5513 |
 |
| Annotated CCD Image 30 sec exposure, 2x2 binning, C Filter 2006-04-23 21:49h UT (#116018) |
 |
 |
| Light curve for HD
5513 based on period 1.1988 days (primary eclipse with either weak or no secondary eclipses) |
 |
 |
Based on apparent period of 1.1988 days estimated from observation through period 2006-06-26 to 2006-10-24, a minimum was predicted for approximately 22-45 - 23:00h UT on 2006-10-28, and a monitoring R & V images were acquired covering a 2 hours either side of this predicted time. The results shown below, confirm a minimum close to the predicted time, and help support the previous period estimate.
|
HD 5513 (Cassiopeia) |
|
|
The possibility that HD 5513 might have a period of 2.3976 days (exactly twice as long as
1.988 day) was considered, but rejected as the shape and depth of the primary
and secondary eclipses looked just too similar to be true.
(Later analysis
in 2008 involving binary star modelling showed a star system with near
identical stars and a period of 2.3976 days was indeed a potential solution).
| Alternative light curve for HD
5513 based on period 2.3976 days (near equal primary and secondary eclipses) |
 |
 |
Back to Top
As part of photometric studies of HD 5501 it was found that HIP 4429 shows brightness variations of ~ 0.15m. Initial analysis suggests a short period variation overlaid on a longer period variation. Further monitoring is being undertaken to see if variation can be confirmed and if there is a regular period or pattern.
In the analysis below the C2 reference star (HD 236584) was used as the sole comparison star, with K3 star acting as the control star.
|
Image showing HIP 4429 |
|
| Annotated CCD Image 30 sec exposure, 2x2 binning, C Filter 2006-04-23 21:49h UT (#116018) |
 |
 |
 |
| HIP 4429 - V Band magnitude variation
for 3 specific nights of observations (2006-10-28, 2006-11-06, 2006-12-19) |
 |
 |
 |
Back to Top
Previous analysis of photometric data from HD 5513 in 2006 had concluded that the light curve was consistent with an eclipsing binary with a period of approximately 1.1988 days, displaying only primary eclipses - with no or very weak secondary eclipses (2006 analysis).
A new review of HD 5513's light curve data in June 2008 questioned whether the original period conclusion was in fact correct. Absence of a secondary eclipse was conjectured to require that the two stars where of different radii, so that larger star was able to eclipse the smaller one, but not vice versa. However since no detectable colour change was observable during the primary eclipse this would suggest that the two stars where of similar temperature and thus most probably of similar size. Since an eclipsing system with similar sized stars would be most likely to show both primary and secondary eclipses, the alternative model for HD 5513 involving a period of 2.3976 days (exactly twice as long as the original estimate from 2006) was re-introduced.
| Original light curve for HD
5513 - period 1.1988 days (no secondary eclipse) |
|
| New alternative light curve for HD
5513 - period 2.3976 days (near equal primary and secondary eclipses) |
| |
The binary star modelling software "Binary Maker 3" ( www.binarymaker.com ) was used to investigate whether the photometric data previously acquired for HD 5513 could be used to confirm which period was actually correct and to see if the binary system could be characterised in more detail.
Temperature
HD 5513 / SAO 21881 has a catalog B-V colour
index (Bt-Vt) of 0.18 . This value corresponds to a temperature of ~ 7960
deg K.
From B and V photometric measurements of HD 5513 (using Comparison Star HD
236584), the measured B-V colour index of HD 5513 is 0.51. This value corresponds
to a cooler temperature of ~ 6480 deg K. Discrepancy between
catalog and measured B-V value has also been noted for star HD 5501. The discrepancy
is as yet unexplained, but may relate to use of a very red comparison star (B-V
index of 1.94).
For the time being it is assumed that the catalog B-V of 0.18 is correct, and for modelling purposes a base temperature of 8000 degK has therefore been assumed.
2.3976 day period system
V Band light curve data assuming a 2.3976 day period was loaded into the Binary Maker program and a star system model created comprising identical stars (mass ratio 1) with non-eccentric - i.e. circular- orbits. This immediately produced a simulated light curve with primary and secondary eclipses. Adjusting the inclination of the system with respect to the observer to a figure of 80 deg produced eclipses with the roughly the right depth. Small adjustments to the individual star properties (200 k temperature difference) was then sufficient to give a reasonable first pass match (Model 1a). It was beginning to seem that 2.3976 days was the correct period !
Further adjustments to the individual star properties including the inclusion of a bright spot on star 2 showed that an even closer match to the observed light curves was possible (Model 1b). Due to noise in the original light curve (possibly due to suspected small variations in the Comparison star), and a data gap between 0.05 and 0.14 phase it wasn't considered worthwhile to explore the full range of possible models matching a 2.3976 day period light curve.
Having demonstrated that a period of 2.3976 days could be modelled, it was now time to investigate whether any binary star models showing only primary eclipses could match the original period estimate of 1.1988 days ?.
1.1988 day period system
V Band light curve data assuming a 1.1988 day period was loaded into the Binary Maker program and a star system model created comprising initially identical stars (mass ratio 1) with non-eccentric - i.e. circular- orbits. Changing the relative size of the stars (using mass ratio and/or fillout parameters) and changing the inclination the system, failed to produce a light curve that had only primary eclipses. Cases with weak secondary eclipse would always produce weak primary eclipses (ie a star that was small enough that it generated a very weak secondary eclipse when eclipsed by the larger star, was too small to produce a deep primary eclipse when it passed across the face of the larger star. Since there are no observed colour changes (B-V, R,-V) during eclipses it ia not possible to employ stars with dramatically different temperatures.
Further modelling showed however that was
possible to produce a light curve
displaying just a primary eclipse with no secondary eclipse by employing an eccentric orbit, oriented in such a way that Star 1 would
eclipse Star 2, but not vice versa. This condition was achieved by setting
eccentricity to 0.40 and setting inclination value to < 75
degrees.
Whilst an inclination of 71 deg provided the right depth of eclipse (Model 2), no solution
could be found that would provide the observed eclipse width; modelled
eclipses would consistently came out too narrow (ie too short) The inability to achieve a match
can probably be explained by the rapid relative motion of the two stars as
they pass by each other at closet approach (primary eclipse has to occur
around this point in order to not get a secondary eclipse). Changing
the relative size of the stars did not help and because there is no B-V colour
change through the eclipse there is limited room for changing star temperatures
dramatically. (Note it wasn't found possible to model a close contact
binary having an eccentric orbit using BM3 - although the program crashed when
attempts were made to render such models were rendered, it may be that such
systems are simply not dynamically
feasible.
At this point it seemed almost certain that Model 1 / period 2.3976 days must be the correct solution for HD5513, however examination of a model of the eclipsing binary CD Eri (CDEri_Bradstreet2005V, Ref 1, Ref2) showed that it might be possible to model HD 5513 as a semi-detached, non-eccentric system, comprising one high luminosity star and one low luminosity star, such that the system shows only a very weak secondary eclipse and has an overall colour index that is strongly dominated by the colour index of the bright star (so that there is minimal B-V colour variation through the primary eclipse). A new model was therefore made based on the parameters of CD Eri. Temperature of star 1 was set to 8000 deg K, with star 2 set at 3000 deg K. Mass ratio, Fillout 1 and Inclination of the system were then adjusted to provide a best fit to the observed light curve for HD 5513 (Model 3). The resulting match to HD5513 light curve is pretty reasonable (at least significantly better than model 2) and shows that the original period estimate of 1.1988 days is still highly possible.
Conclusion
Based on Binary Star Modelling and the light
curve data from 2006 it seems possible to model HD 5513 as a system with
similarly sized primary and secondary eclipses (period 2.3976 days) or
alternatively as a system with a primary eclipse with weak secondary eclipse
(period 1.1988 days)
Higher quality data is needed from HD 5513 to allow a clear identification of the correct solution, it would be hoped to observe either firm differences between the primary and secondary eclipses on a 2.3976 period or firm evidence of secondary eclipses on a 1.1988 day period.
References
1) CD Eri, Catalog and Atlas of Eclipsing Binaries, CALEB Website http://caleb.eastern.edu/model_display.php?model_id=1075
2)
Kandpal, C. D. & Srivastava, J. B. �Photoelectric Study of the
Eclipsing System CD Eridani: 1980, Astrophysics & Space Science, Volume 67,
pp. 213-227
http://adsabs.harvard.edu/cgi-bin/nph-bib_query?bibcode=1980Ap%26SS..67..213K&db_key
=AST&data_type=HTML&format=&high=4318b7715d09640
Figures & graphs
| HD 5513 - Binary
Star Modelling Plots produced using Binary Maker 3 Note: in the plots below there is noise in observed light curve data which is attributed to a combination of imaging noise & suspected slight variation in the comparison star. |
||
|
|
||
| Model 1a Simple model with reasonable match to observed light curve data Mass ratio = 1.0, Inclination = 78 deg, Near identical stars 2.3976 day period - distinct primary & secondary eclipses |
||
 |
||
| + = light flux data (V) from HD 5513 | square = modelled light flux (5500A) | |
| Model 1a Params Mass ratio = 1.0 Inclination = 78 deg Fillout 1 = -0.3 Temperature 1= 8000 K Rotation F1 = 1.0 Reflection 1 = 0.5 Limb darkening 1 = 0.58 |
Eccentricity = 0.0 Fillout 2 = -0.3 Temperature 2 = 7800 K Rotation F2 = 1.0 Reflection 2 = 0.5 Limb darkening 2 = 0.58 |
|
|
|
||
| Model 1b Refined model with pretty good match to observed light curve data Mass ratio = 1.0, Inclination = 80 deg, Less identical stars, spot on star 2 2.3976 day period - primary & secondary eclipses Model 1b is almost certainly not a unique solution, but demonstrates that light curve data can be reasonably well matched by adjusting star parameters. |
||
 |
||
| + = light flux data (V) from HD 5513 | square = modelled light flux (5500A) | |
| Model 2 Params Mass ratio = 1.0 Inclination = 80 deg Fillout 1 = -0.2 Temperature 1= 8000 K Rotation F1 = 2.2 Reflection 1 = 1.0 Limb darkening 1 = 0.58 |
Eccentricity = 0.0 Fillout 2 = -0.3 Temperature 2 = 7500 K Rotation F2 = 1.5 Reflection 2 = 0.1 Limb darkening 2 = 0.58 Spot Colatitude = 90 deg, Longitude = 30 deg Radius = 10 deg Temp Factor = 1.30 |
|
|
|
||
| Model 2 Eccentric orbit model with poor (unacceptable) match to observed light curve data Mass ratio = 1.0, Inclination = 71 deg, Near identical stars, Eccentric Orbit - Eccentricty 0.4 1.1988 day period - distinct primary eclipse, no secondary eclipse |
||
 |
||
| + = light flux data (V) from HD 5513 | square = modelled light flux (5500A) | |
| Model 1 Params Mass ratio = 1.0 Inclination = 71 deg Fillout 1 = -0.2 Temperature 1= 8000 K Rotation F1 = 1.0 Reflection 1 = 0.5 Limb darkening 1 = 0.58 |
Eccentricity = 0.4 Longitude of periastron = 270 deg Fillout 2 = -0.2 Temperature 2 = 8000 K Rotation F2 = 1.0 Reflection 2 = 0.5 Limb darkening 2 = 0.58 |
|
|
|
||
| Model 3 Semi-detached system with one luminous star and one less luminous star, with pretty good match to observed light curve data Mass ratio = 0.6, Inclination = 65 deg, quite different stars, Circulars Orbits 1.1988 day period - distinct primary eclipse, weak secondary eclipse |
||
 |
||
| + = light flux data (V) from HD 5513 | square = modelled light flux (5500A) | |
| Model 1 Params Mass ratio = 0.6 Inclination = 65 deg Fillout 1 = -0.22 Temperature 1= 8000 K Rotation F1 = 1.0 Reflection 1 = 1.0 Gravity coefficient 1 = 1.00 Limb darkening 1 = 0.531 Luminosity 1 = 0.9949 |
Eccentricity = 0.0
|
|
|
|
||
| HD 5513 - Binary
Star Animations
Animations shown below for three main models built for the star |
||
| Model 1 - period 2.3976 days Phase Increment 0.05 (2h 53m) |
||
 |
||
| Model 1 shows both primary
and secondary eclipses (Phase 0.00 and 0.50) The two stars are very similar and produce very similar primary and secondary eclipses matching the observed data |
||
| Model 2 -
period 1.1988 days Phase Increment 0.05 (1h 26m) |
||
 |
||
| Model 2 shows just a primary
eclipse (Phase 0.00), with no secondary eclipse The primary eclipse occurs at the point of closest approach between the two stars and is of much shorter duration than the eclipse actually observed |
||
| Model 3 -
period 1.1988 days Phase Increment 0.05 (1h 26m) |
||
 |
||
| Model 3 shows a distinct primary
eclipse, but the secondary eclipse (phase 0.5) is weak as star 2 is of much lower luminosity |
||
|
|
||
Back to Top
| This Web Page: | Variable Stars - HD 5501 & HD 5513 |
| Last Updated : | 2015-02-25 |
| Site Owner : | David Richards |
| Home Page : | David's Astronomy Web Site |