David's Astronomy Pages
|
Computer Control |
Home Page |
Image Gallery |
|
Astronomical spectroscopy is the study is the spectrum of electromagnetic radiation, including visible , UV and infrared light which radiates from stars and other celestial objects. Spectroscopy can be used to derive many properties of distant stars and galaxies, such as their chemical composition and also their motion, via the Doppler shift.
A bright hot source (like a star) emits a continuum of radiation which a spectroscope (diffraction grating or prism) can break down into a spectrum. When a light source passes through a tenuous gas consisting of elements, ions (plasma) or molecules, certain discrete wavelengths are removed from the continuum giving rise to dark absorption lines which fingerprint an element (and/or its ionic state) or molecule. The light from a star passing through the outer atmosphere layers of the star give rise to this effect. When a tenuous gas consisting of elements, ions and/or molecules is excited in some manner (collisional, electrically, heat or by light itself), the gas emits certain discrete wavelengths. These are seen as bright lines. Certain gaseous nebula or planetary nebula are good examples of this.
I began experimenting with spectroscopy in April 2008 soon after listening to an inspiring talk by Robin Leadbeater at a joint meeting of BAA VSS & AAVSO in Cambridge, 10-13th April, 2008. The talk was entitled 'Chasing Rainbows - The European amateur spectroscopy scene'. Covering both high-resolution and low-resolution spectroscopy, it included a description of what can be achieved with relatively simple slitless equipment incorporating Paton Hawksley's Star Analyser 100.
The Star Analyser 100 is a 100 lines/mm transmission grating set in a filter cell. It appeared that it could be relatively easily incorporated into my existing imaging set up, though I would have to free up one of the slots in my filter wheel used by one of my existing BRVI filters, and allow be to explore a whole new area of astronomical study. Deciding that I could forego the use of my I-Band filter I quickly proceeded with the purchase of a Star Analyser 100 direct from the manufacturer and captured my first star spectra on 17th April 2008, just 6 days after hearing Robin's talk [ first spectra images, 2008-04-17].
I typically work with Spectra dispersion of 33.5 A/pixel (3733 A/mm), and have a calculated practical resolution of between 70 and 110 A.
Back to Top
I began using a Star Analyser 100 in April 2008.
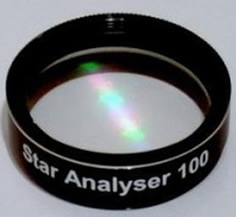 |
Star Analyser 100 - high quality transmission diffraction grating mounted in a standard 1.25 inch filter cell - high efficiency 100 lines/mm blazed design - grating surface protected by anti-reflection coated glass - screws into an eyepiece or filter wheel like a normal filter - star and spectrum can be recorded in the same image, which aids identification and calibration - provides low resolution slitless spectroscopy, but for relatively low cost (£78 + p&p, Apr 2008) Manufactured by : Paton Hawksley Education Ltd Product Page : http://www.patonhawksley.co.uk/staranalyser.html |
Back to Top
| Vega, blue-white star A0 spectra |
|
|
CCD Spectra Image 3 x 0.5s, 1x1 binning, Dispersion 33.6 A/px 2008-05-07 23:01hUT (#286046-48) (colour spectra is synthesized from black-white spectra) |
| R Aur, red star with infrared
excess M6-M8 spectra |
|
|
CCD Spectra Image 5 x 60s, 1x1 binning, Dispersion 33.6 A/px 2008-04-24 22:05hUT (#284033-35) (colour spectra is synthesized from black-white spectra) |
Back to Top
| Spectral Absorption Lines in Vega (Lyra) O2 and H2O lines are due to absorption in the Earth's atmosphere) H-epsilon and H-zeta lines are not visible due to decreasing sensitivity of CCD chip in violet region and overall low resolution. |
||||||||||||||||||||||||||||||||||||
|
||||||||||||||||||||||||||||||||||||
|
CCD Spectra Image (200%) 3 x 0.5s, 1x1 binning, Original Dispersion 33.6 A/px 2008-05-07 23:01hUT (#286046-48) |
||||||||||||||||||||||||||||||||||||
| Spectral Absorption Lines in Deneb
(Cygnus) O2 and H2O lines are due to absorption in the Earth's atmosphere) |
||||||||||||||||||||||||||||||||||||
|
||||||||||||||||||||||||||||||||||||
|
CCD Spectra Image (200%) 5 x 5s, 1x1 binning, Original Dispersion 33.6 A/px 2008-05-03 01:24hUT (#285161-65) |
||||||||||||||||||||||||||||||||||||
| Spectral Emission Lines in P Cyg (Cygnus) | ||||||||||||||||||||||||||||||||||||
|
||||||||||||||||||||||||||||||||||||
|
CCD Spectra Image (200%) 3 x 10s, 1x1 binning, Original Dispersion 33.6 A/px 2008-05-08 01:16hUT (#286177-79) |
||||||||||||||||||||||||||||||||||||
| Table of Balmer Lines | ||||||||||||||||||||||||||||||||||||
|
||||||||||||||||||||||||||||||||||||
Back to Top
Dispersion
Dispersion is a measure of the change in wavelength of the diffracted
length along the surface of the CCD. It is usually measured in angstrom
per pixel. It can be determined by observing a star spectrum that has
known features. For example in the following spectra of Vega, the H-alpha
(6563 A) and H beta (4861 A) lines lie at original pixel values of 440 and 389
respectively.
Dispersion (image) = (6563 - 4861) / (440 - 389) = 33.4 A per pixel
Based on several measurements of several pairs of lines in a number of spectral images an average dispersion value of 33.6 A / pixel was obtained.
Dispersion (average) = 33.6 A per pixel
| Spectral Lines in Vega (Lyra) |
|
|
|
CCD Spectra Image (200%) 3 x 0.5s, 1x1 binning, Original Dispersion 33.6 A/px 2008-05-07 23:01hUT (#286046-48) |
Plate Factor (P)
Plate Factor, P, is similarly a measure of the change in
wavelength of the diffracted length along the surface of the CCD, but is usually
measured in angstrom per mm. It can be determined from the above
Dispersion value knowing the physical pixel size.
For my ST-7e camera (KAF-401-E), the size of the pixels is 9 x 9 mm
(0.009 x 0.009 mm)
Average Plate Factor, P = 33.6 / 0.009 = 3733 A / mm
Distance from grating to CCD (d)
It is not possible to accurately measure the distance between the grating and
the CCD, however it can be calculated using the grating equation, which for
slitless spectrography and first order spectrum reduces to sin b
= m l where b
is the deviation angle, m is the number of grooves per millimeter and l
is wavelength.
For Star Analyser 100 (100 groves/mm) I find that
the H-alpha line (6563 A) typically lies at a distance of 196 pixels from the
zero order star image. Thus,
x = 1.764mm (from 196 * 0.009)
l
= 0.0006563 mm
sin b
= 100 g/mm * 0.0006563 mm
b = 3.7630 deg
d = x / tan b = 1.764 / tan
(3.7630)
d = 26.82 mm
Back to Top
Dispersion
Dispersion is a measure of the change in wavelength of the diffracted
length along the surface of the CCD. It is usually measured in angstrom
per pixel. It can be determined by observing a star spectrum that has
known features. One method uses two emission/absorption lines, whilst
another method uses the zero order star position and one emission/absorption
line.
For example in the following spectra of Vega (produced from 2x2 binned image), disperison is found to lie in the range 25.22 and 25.87
| Spectral Lines in Vega (Lyra) |
|
|
CCD Spectra Image (Star Analyser 200) (Image rotated & cropped) 1 x 0.2s exposure, 2x2 binning, S Filter 2015-04-21 03:43 h UT (#585269-73) 12" LX200R (at f/10.4) + ST-10XME |
1) Taking the H-alpha (6563 A) and H gamma (4341 A) lines lying at original pixel position of 869.0 and 780.9 respectively gives a dispersion of 25.22 A per pixel [calculated from (6563 - 4341) / (869.0 - 780.9) ]
2a) Taking the H-alpha (6563 A) line and zero order star position (0 A) lying at original pixel positions of 869.0 and 613.1 respectively gives a dispersion of 25.65 A per pixel [calculated from (6563 - 0) / (869.0 - 613.1) ]
2b) Taking the H gamma (4341 A) line and zero order star position (0 A) lying at original pixel positions of 780.9 and 613.1 respectively gives a dispersion of 25.87 A per pixel [calculated from (4341- 0) / (780.9 - 613.1) ]
Dispersion seems to be slightly non-linear.
Based on Zero Order star and several aborptions lines a non-linear calibration table was defined and used to calibrate the Vega image. Average dispersion for non-linear calibration is 25.5 A/px (2x2 binning)
Plate Factor (P)
Plate Factor, P, is similarly a measure of the change in
wavelength of the diffracted length along the surface of the CCD, but is usually
measured in angstrom per mm. It can be determined from the above
Dispersion value knowing the physical pixel size.
For my ST-10E camera (KAF-401-E), the size of the pixels at 1x1
binning is 6.8 x 6.8 mm
(0.0068 x 0.0068 mm)
At 2x2 binning (currently used for spectroscopy
work)
Average Plate Factor, P = 25.5 / (0.0068*2) = 1875 A / mm
At 1x1 binning the plate factor is still 1875 A / mm (from P = 12.75 / 0.0068)
Distance from grating to CCD (d)
It is not possible to accurately measure the distance between the grating and
the CCD, however it can be calculated using the grating equation, which for
slitless spectrography and first order spectrum reduces to sin b
= m l where b
is the deviation angle, m is the number of grooves per millimeter and l
is wavelength.
For Star Analyser 200 (100 grooves/mm) I find that
the H-alpha line (6563 A) typically lies at a distance of 256 pixels from the
zero order star image (at 2x2 binning). Thus,
x = 3.4816mm (from 256 * 0.0068 x 2)
l
= 0.0006563 mm
sin b
= 200 g/mm * 0.0006563 mm
b = 7.519 deg
d = x / tan b = 3.4816 / tan
(7.519)
d = 26.38 mm (cf. 26.82mm for Star
Analyser 100 with 8" LX200 & ST-7E)
Calculated dispersion of my 12" LX200 system (values calculated using calculator at http://www.patonhawksley.co.uk/calculator/ )
|
Grating Distance |
Dispersion |
(A/px) |
||
| mm | SA100, 1x1 binning |
SA100, 2x2 binning |
SA200, 1x1 binning |
SA200, 2x2 binning |
| 20 | 34.0 | 68.0 | 17.0 | 34.0 |
| 25 | 27.2 | 54.4 | 13.6 | 27.2 |
| 26.4 * | 25.8 | 51.5 | 12.9 | 25.8 |
| 30 | 22.7 | 45.3 | 11.3 | 22.7 |
| 35 | 19.4 | 38.9 | 9.7 | 19.4 |
| 40 | 17.0 | 34.0 | 8.5 | 17.0 |
26.4 mm is largest practical grating distance achieved with ST-10 + CFW10
filter wheel
A spectrograph's spectral resolution, R, determines the ability of the instrument to distinguish spectral features separated by Dl . The spectral resolution is a dimensionless quantity that is a measure of spectral purity (Dl).
For the case of my Meade LX200 8" (operating at f7.4), Star Analyser 100 and SBIG ST-7e CCD the following quantities are known:
d = distance from grating to CCD = 26.8 mm
k = order of spectrum = 1
m = number of grooves per mm = 100 g/mm
D = telescope diameter = 203.2 mm
F = telescope focal length = 1498 mm
N = F/D = focal ratio = 7.4
Since the entire surface of the grating is not illuminated the theoretical resolution becomes
R = mLk,
where L = gratings lit width (portion of grating
illuminated by the star’s image from the telescope), or Dd/F
Dl = l/
R
[ Reference: "Resolution Calculation for a Slitless Spectrograph" By
Dr. Doug West.
http://users.erols.com/njastro/faas/articles/west01.htm
]
For my 8" LX200/ST-7E/SA100 setup L = Dd / F = (203.2mm) x (26.8mm)/1498mm = 3.64 mm
The theoretical resolution, R is thus given by
R = (100 g/mm) x (3.64 mm) x (1) = 364
Spectrographs are considered low resolution when they have R<1000. This with an R value of just 364, my system is confirmed as being low resolution.
My theoretical resolution, at H-alpha line (6563 A) is thus given by
Dl = l/ R = 6563 / 364 = 18 A
The actual resolution of the spectrograph (70 - 110 A) turns out to be much lower.
With Dispersion of 33.6 A/pixel, it is immediately apparent that the minimal resolution of the system has to be at least 67 A (from 2 x 33.6). Other factors limiting resolution are Chromatic Coma, Field Curvature and FWHM of the star image.
For my 12" LX200 setup L = Dd / F = (305mm) x (26.38mm)/3048mm = 2.64 mm
The theoretical resolution with SA100, R is given by
R = (100 g/mm) x (2.64 mm) x (1) = 264
The theoretical resolution with SA200, R is given by
R = (200 g/mm) x (2.64 mm) x (1) = 528
Spectrographs are considered low resolution when they have R<1000. With an R value of 528, my system with SA200 is confirmed as still being low resolution, albeit with twice the resolution of the SA100 grating.
My theoretical resolutions, at H-alpha line (6563 A) is thus given by
Dl = l/ R = 6563 / 264 = 25A (for SA100)
Dl = l/ R = 6563 / 528 = 12.5 A (for SA100)
The actual resolution of the spectrograph (70 - 110 A) turns out to be much lower.
With Dispersion of 25.5 A/pixel (SA200 at 2x2 binning), it is immediately apparent that the minimal resolution of the system has to be at least 51A (from 2 x 25.5). Other factors limiting resolution are Chromatic Coma, Field Curvature and FWHM of the star image.
Back to Top
The actual resolution of a spectrograph turns out to be much lower than the theoretical resolution. Factors limiting resolution are Chromatic Coma, Field Curvature, FWHM of star image and Sampling Theorem (pixel size).
For my setup FWHM and Pixel Size are the main limiting factors, which limit spectral resolution to a value of 70 A at best with a more typical value of around 110 A.
These values are derived from calculations shown
below which are themselves based on equations given in
"Resolution Calculation for a Slitless Spectrograph" by Dr. Doug
West. [http://users.erols.com/njastro/faas/articles/west01.htm].
1. Chromatic Coma
The practical formula for the effect of chromatic coma on spectural purity
is
Dl = (3l)/ (16 N2), where N is focal ratio
For my 8" LX200 / ST7 system operating at f/7.4 the effect of chromatic coma on spectural purity at the H-alpha line (6563 A) is
Dl = (3 x 6563 )/ (16 x (7.4)2 ) = 22.5 A
For my 12" LX200 / ST-10 system operating at f/10.4 the effect of chromatic coma on spectural purity at the H-alpha line (6563 A) is
Dl = (3 x 6563 )/ (16 x (10.4)2 ) = 11.4 A
2. Field Curvature
This is the effect on spectural purity cause by the aberration due to field
curvature, which results from the cylindrical rather than planar nature of the
spectrum’s focus. The defocusing effect produced by field curvature
significantly reduces the spectrograph’s resolution.
Resolving power is given by
Dl = DxP = PL ((1/cosb)-1)
For my 8" LX200 / ST-7 system operating at f/7.4 at l= 6563 A, b = 3.7630 deg, L = 3.64 mm and P = 3733 A / mm, the spectral purity
Dl = PL ((1/cosb)-1) = (3733 A/mm) x (3.64mm) x ((1/cos3.763) -1) = 29.4 A
For my 12" LX200 / ST-10 system operating at f/10.4 at l= 6563 A, b =7.519 deg, L = 2.64 mm and P = 1875A / mm, the spectral purity
Dl = PL ((1/cosb)-1) = (1875A/mm) x (2.64mm) x ((1/cos7.519) -1) = 42.9 A
3. FWHM of Star Image
In a slitless spectrograph the full width at half maximum (FWHM) of the star’s image becomes the effective entrance slit width for the instrument. The larger the slit width the lower the resolution and spectral resolving power.
The spectral resolving power is given by:Dl = (FWHM) x (e) x (P) / cos b
For my 8" LX200 + ST-7 + f/7.4 setup at l= 6563 A, b = 3.7630 deg, P = 3733 A / mm and typical FWHM of 4 arc sec, equivalent to 3.25 pixels at 1x1 binning, Dl becomes
Dl = (3.25 px) x (0.009 mm) x (3733) / cos 3.763 = 109 A
The spectral resolving power for other FWHM values is given in
the table below.
In practice a FWHM of 2.0 and resolving power of 55 A is the best that can be
achieved at my site for short exposures (1-2 secs duration).
FWHM
(arc secs)Dl 2.0
55 A 2.5
68 A 3.0
82 A 3.5
96 A 4.0
109 A 4.5
123 A 5.0 137 A 5.5 151 A
For my 12" LX200 + ST-10 + f/10.4 + SA200 setup at l= 6563 A, b =7.519 deg, P = 1875 A / mm, plate scale = 0.884 arc sec/pixel at 2x2 binning and typical FWHM of 4 arc sec, equivalent to 4.5 pixels at 2x2 binning, Dl becomes
Dl = (4.5px) x (0.0136 mm) x (1875) / cos 7.519 = 116 A
In practice a FWHM of 2.0 and resolving power of around 58 A is the best that can be achieved at my site for short exposures (1-2 secs duration).
| FWHM (arc secs) |
Dl | |
|
2.0 |
58 A | |
|
2.5 |
73 A | |
|
3.0 |
87 A | |
|
3.5 |
102 A | |
|
4.0 |
116 A | |
|
4.5 |
131 A | |
| 5.0 | 145 A | |
| 5.5 | 160 A |
4. Sampling Theorem
When a continuous signal is sampled, such as a spectra, this process places a lower limit on the spectra purity. Simply put, the sampling theorem states that the highest frequency present in a sampled waveform is one half the sampling rate. The implication of this theorem on the spectrograph is that the smallest value of spectral purity possible is twice the wavelength interval covered by a pixel, or
Dl = 2 e P
For my 8" LX200 imaging setup with Star Analyser 100 and 1x1 binning (9 mm, 0.009 mm pixels) and P = 3733 A / mm, the smallest value of spectral purity is
Dl = 2 e P = (2) x (0.009 mm) x (3733 A/mm) = 67.2 A
For my 12" LX200 imaging setup with Star Analyser 100 and 2x2 binning (13.6 mm, 0.0136 mm pixels) and P = 3750 A / mm, the smallest value of spectral purity is
Dl = 2 e P = (2) x (0.0136 mm) x (3750 A/mm) = 102 A (51 A for 1x1 binning)
For my 12" LX200 imaging setup with Star Analyser 200 and 2x2 binning (13.6 mm, 0.0136 mm pixels) and P = 1875 A / mm, the smallest value of spectral purity is
Dl = 2 e P = (2) x (0.0136 mm) x (1875 A/mm) = 51 A
For my 12" LX200 imaging setup with Star Analyser 200 and 1x1 binning (6.8 mm, 0.0068 mm pixels) and P = 1875 A / mm, the smallest value of spectral purity is
Dl = 2 e P = (2) x (0.0068 mm) x (1875 A/mm) = 25.5 A
Whilst 1x1 binning theoretically has higher resolution (25.5 A vs 51 A), seeing limits the resolution to around 58 A at best at my site (for 2 arc sec FWHM)
Back to Top
Image Acquisition
TheSky
CCDSoft
AIS (VB.Net) Program - Observatory Module
Spectra Manipulation / Analysis
CCDSoft
AIS (VB.Net) Program - Analysis Module
AstroImage Tool (Delphi) Program
VisualSpec
Excel
Back to Top
Workflows are still being developed. The following section describes the workflow that has evolved after around 5 or 6 imaging sessions.
General Setup (one time operation per imaging setup)
Insert SA100 into selected slot in filter wheel and attach between CCD Camera and focal-reducer/focuser/telescope
Image a reasonably bright star and identify the position of the blazed (bright) first order spectrum relative to the zero order image
Define (in arc mins) the optimal N and W
offset of the star relative to image centre to ensure that first order
spectra is well positioned on the CCD image
(see SA100 image below)
Identify the focuser offset (ie.number of
steps) between focused SA100 images and focused C Filter images
(see graph of
SA100 & C filter focusing offset)
|
SA100 image,
showing zero order star image with principal |
 |
Target Selection (for each star/other object)
Choose target star (from project list or star catalogue). Note star's catalog magnitude.
Add a new target to session's imaging list.
Enter appropriate target name (a star name or identifier that is recognisable to TheSky)
Enter N & W offsets, and a suitable
position fine-tuning method
The two principle methods used are a) brightest star method for bright
targets & b) image link method for dim targets
Select appropriate binning level (normally this is 1x1 binning for taking spectra, where best resolution is sought)
Select number of frames (normally 3 or 5)
Select or guesstimate optimal exposure time using graph of suitable Exposure Time vs Star Magnitude. Aim is to chose a convenient exposure (eg 1s, 5s, 10s, 20s, 60s, 120s) that neither under or overexposes the CCD image.
|
Specification of Spectra Images for the star Spica (Alpha Virginis) |
 |
Imaging Run
Initiate new observing session
Select Session Imaging List and commence
imaging run
- My AIS software then runs through the target list imaging each target in
turn using the specified target/image specification
- The software automatically adjusts the focus position (TCF-S) depending on
whether SA100 images of C Filter (Locate) images are being taken
Optionally monitor spectra images in
real-time to check that first order spectra is neither under or over exposed
- If necessary resubmit particular target star using either longer or
shorter exposure (whichever is appropriate)
|
Imaging Run - Example |
 |
|
|
|
Exposure Check |
 |
Image Reduction (after each observing session)
Build session summary file (based on data recorded in FITS headers)
Reduce raw images using appropriate Dark and Flat Frames
Compile reduced images into Folder Sets by
target object
Finally, set VisualSpec working folder to the Session Folder (this is the parent folder to individual target folders)
Spectral Image Manipulation/Analysis (for each star object) - example P Cyg
Align and stack individual frames (if relevant, typically 3 or 5 frames)
Rotate Spectral image so that first order
spectra is aligned in the X direction and lying to the right of the zero
order image
(for my setup this has typically meant a rotation of 140 deg +/- 1 deg)
Save copy of rotated spectral image with name acceptable to VisualSpec (this means removing all but one '.' character from file name)
Auto-select brightest star / store brightest
star X/Y position using a utility within my AIS software program.
Optionally manually record target star X/Y position if the target is not the
brightest star
Auto crop Spectra Image to 450 x 70 pixel sized FITS image using a utitlity within my AstroImage Program. Star is automatically position at 35,35. Adjust Black-White Range and capture as a gif image.
Open rotated FITS image in VisualSpec and position suitable sized reference binning zone over star + spectra (avoiding adjacent stars)
Perform Object Binning. Save profile in Target Folder as 'profile.spc'
Build 450 x 50 pixel sized Spectra Tab using a utility function within my AstroImage Program. Star is automatically position at X=35. Adjust Black-White range and capture as a gif image

Optionally build Red, Green, Blue FITS frames
to represent synthetic colour from calibrated wavelength using uitility
within my AstroImage Program. Build Colour composite using LRGB colour
combine facility in CCDSoft. Capture coloured spectra tab as a .jpg
image.
(need colour synthetic of P Cyg here)
Alternative method: Use VSpec utility - Tools/Synthesis - to produce a monochromatic Spectra Tab, followed by use of the "Colorer" (Colour) option.
This produces a spectra tab that can be captured, resized & cropped. A particularly nice feature of the VSpec utility is that moving vertical line cursor along the Spectra profile, moves a corresponding vertical line cursor on the Spectra Tab.
Import Profile into Excel Workbook, which automatically prepares a standard sized profile with normalised Y range. Capture standard graph and detailed graphs (200% X scaling) as a gif image.
Scale Spectra Tab X by 200% and crop to a detailed 450 x 50 sized gif image.
Identify Spectra Lines and annotate detailed Spectral profile
Document spectral images on Session Web Page (see P Cyg on S286 page)
Wavelength Calibration
Calibrations when made have involved either 1 or 2 line calibration using profile in Visual Spec and dispersion of 33.6 A/pixel
Radiometric Calibration
I've only just begun looking into radiometric
calibration to take out effects of instrumental sensitivity.
Method
- Open spectrum of a star which is "quite well known"
and bright. Vega, Altair,
(no spectral type with too many lines like K
stars.Perform wavelength calibration)
- Get a "standard" spectrum of this star
"corrected of the instrumental response"
either in the Vspec database (pick the spectral type
which is closest) or from the net.
- divide the raw spectrum by its "corrected" spectrum
- eliminate the lines, smooth the profile with the continuum extraction
function
- save the result as your instrumental response
- pick any spectrum from another observed star
- divide it by the response profile and that's it
Back to Top
A catalogue of star spectra taken using LX200, Star Analyser 100 and SBIG ST-7e :
|
Star Name (designation) |
Spectra Type (catalog) |
Spectra Lines ( Star Analyser 100) |
Image Date/No. & Notes |
||
| SAO 49491 Cyg |
WR Wolf Rayet |
 |
2008-04-18 (#283378-82) | ||
| SAO 69402 HD 190918, Cyg |
Wolf Rayet |  |
2008-04-25 (#284317-19) | ||
| P Cyg | B1Iapeq | |
2008-05-08 (#286177-79) | ||
| 10 Lac | 09 |  |
2008-05-08 (#286167-69) | ||
| Zeta (13) Oph HIP 81377 |
09 |  |
2008-05-08 (#286142-44) | ||
| Spica Alpha Vir |
B1 |  |
2008-05-02 (#285031-35) | ||
| Regulus Alpha Leo |
B7 |  |
2008-04-17 (#283073-75) | ||
| Albireo(B) Beta2 Cyg |
B8 |  |
2008-04-18 (#283311-17) | ||
| 4 Her | B9 |  |
2008-04-25 (#284120-22) | ||
| 108 Vir | B9 |  |
2008-04-25 (#284301-05) | ||
| Vega Alpha Lyr |
A0 |
 |
2008-04-18 (#283304-10) | ||
| Vega Alpha Lyr |
A0 |  |
2008-04-25 (#284127-31) | ||
| Deneb Alpha Cyg |
A2 |  |
2008-05-03 (#285161-65) | ||
| Castor Alpha Gem |
A2 |  |
2008-04-17 (#283070-72) | ||
| Procyon Alpha CMi |
F5 |  |
2008-04-17 (#283058-60) | ||
| Izar Epsilon Boo |
(A0) |  |
2008-05-02 (285050-54) | ||
| Sadr Gamma Cyg |
F8 |  |
2008-05-03 (#285149-53) | ||
| Rastaban Beta Dra |
G2 |  |
2008-05-18 (#288137-39) | ||
| Groombridge 1830, UMa | G8 |  |
2008-04-25 (#284161-63) | ||
| Pollux Beta Gem |
K0 |  |
2008-04-17 (#283064-66) | ||
| Arcturus Alpha Boo |
K2 |  |
2008-04-24 (#284006-9) | ||
| Albireo(A) Beta1 Cyg |
K3 |  |
2008-04-18 (#283311-17) | ||
| 61 Cyg | K5 |  |
2008-04-18 (#283268-70) | ||
| Groombridge 34 And |
M1 |  |
2008-05-08 (#286242-44) | ||
| Yed Prior Delta Oph |
M1 |  |
2008-05-08 (#286147-49) | ||
| Betelgeuse Alpha Ori |
M2 |  |
2008-04-20 (#283506-11) | ||
| Lalande 21185 HIP 54035, UMa |
M2 |  |
2008-04-25 (#284178-80) | ||
| V0973 Cyg HIP 97151 |
M3 |  |
2008-05-08 (#286212-14) | ||
| R Boo | M3-M8 |  |
2008-04-25 (#284310-12) | ||
| R Vir | M3-M8 |  |
2008-04-24 (#284089-91) | ||
| XY Lyr | M4 |  |
2008-05-08 (#286153-55) | ||
| RR CrB | M5 |  |
2008-04-24 (#284052-56) | ||
| R Lyr | M5 |  |
2008-05-08 (#286189-91) | ||
| R Aur | M6-M9 | |
2008-04-24 (#284033-35) | ||
| R Leo | M6-M9 |  |
2008-04-24 (#284043-45) | ||
| U Her | M6-M9 |  |
2008-04-17 (#283143-45) | ||
| Y CVn | C5 |  |
2008-04-24 (#284106-10) | ||
| V0460 Cyg | C6,4(N1) |  |
2008-05-08 (#286217-19) | ||
| Cyg U | C7-C9 |  |
2008-04-25 (#284286-88) | ||
Back to Top
|
Star Name (designation) |
Spectra Type (catalog) |
Spectra (Star Analyser 100) |
Image details (1x1 binning) |
||
| NGC 2022 | Pl. Neb |  |
3 x 120s 2008-12-18 (#335276-78) |
||
| NGC 2392 | Pl. Neb | 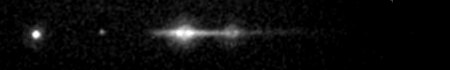 |
3 x 45s 2009-01-09 (#342143-45) |
||
| NGC 6572 | Pl. Neb |  |
3 x 45s 2008-04-18 (#283245-47) |
||
| NGC 6210 | Pl. Neb |  |
3x60s 2008-05-18 (#286101-03) |
||
| NGC 6826 | Pl. Neb |  |
3 x 60s 2008-04-18 (#283337-39) |
||
| NGC 7026 | Pl. Neb |  |
3 x 45s 2008-05-07 (#286182-84) |
||
| NGC 7662 | Pl. Neb |  |
3 x 60s 2008-04-18 (#283346-48) |
||
| M57 | Pl. Neb | 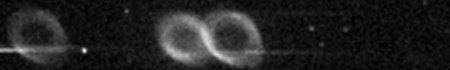 |
3 x 30s 2008-04-18 (#283301-03) |
||
| NGC 6572 | Pl. Neb |  |
2008-04-18 (#283245-47) | ||
| NGC 6826 | Pl. Neb |  |
2008-04-18 (#283337-39) | ||
Back to Top
|
Original monochromatic Spectral
Displays with synthesized Coloured Spectral Equivalents |
|||||
| Visible Light Range |
 |
||||
|
Star Name (designation) |
Spectra Type (catalog) |
Spectra Lines ( Star Analyser 100) |
Image Date/No. & Notes |
||
| Spica Alpha Vir |
B1 | |
2008-05-02 (#285031-35) | ||
| Spica Alpha Vir |
 |
||||
| Izar Epsilon Boo |
A0 ?? |
|
2008-05-02 (285050-54) | ||
| Izar Epsilon Boo |
 |
||||
| R Aur | M6-M9 | |
2008-04-24 (#284033-35) | ||
| R Aur | |
significant infrared component | |||
| NGC 6572 Pl. Neb |
Pl. Neb |
|
2008-04-18 (#283245-47) | ||
| NGC 6572 Pl. Neb |
 |
||||
Back to Top
| Theoretical overall spectral response
of the SA 100 operating with KAF-401E CCD Chip in SBIG ST-7e camera is shown in the graph below |
|
|
|
From Kodak KAF-401 E performance specification (June 2000) (copy at http://www.lancs.ac.uk/depts/spc/resources/observatory/kaf-0401e.pdf ) |
|
Comparison of Spectra Response of
ST-7e Camera, |
|||||
| Visible Light Range |
|
||||
| CCD Camera Response (ST-7e ) |
 |
Note relatively low response at blue end of spectrum, especially violet and UV |
|||
| Spica Alpha Vir |
B1 | |
2008-05-02 (#285031-35) | ||
| Albireo(A) Beta1 Cyg |
K3 | |
2008-04-18 (#283311-17) | ||
| R Aur | M6-M9 | |
2008-04-24 (#284033-35) | ||
|
Star Name (designation) |
Spectra Type (catalog) |
Spectra Lines ( Star Analyser 100) |
Image Date/No. & Notes |
||
Back to Top
|
Comparison of Spectra Response of
ST-7e Camera, |
|||||
| CCD Camera Response (ST-7e ) |
|
Note relatively low response at blue end of spectrum |
|||
| Visible Light Range |
|
||||
| UBVRI Filters |
 |
||||
| Example stars | |||||
| Spica Alpha Vir |
B1 | |
2008-05-02 (#285031-35) | ||
| Spica Alpha Vir |
|
significant blue and ?ultraviolet component |
|||
| R Aur | M6-M9 | |
2008-04-24 (#284033-35) | ||
| R Aur | |
significant infrared component |
|||
|
Star Name (designation) |
Spectra Type (catalog) |
Spectra Lines ( Star Analyser 100) |
Image Date/No. & Notes |
||
Back to Top
|
Graph showing Exposure Times for Spectral Images for
different star magnitudes 8" LX200 operating at f/7.4, ST-7E, Star Analyser 100 -1 overexposed, +3 significantly underexposed |
|
Back to Top
| This Web Page: | Spectroscopy |
| Last Updated : | 2015-05-16 |
| Site Owner : | David Richards |
| Home Page : | David's Astronomy Web Site |